
Page 194 - SUSTAINABILITY ISSUES & COVID-19
P. 194
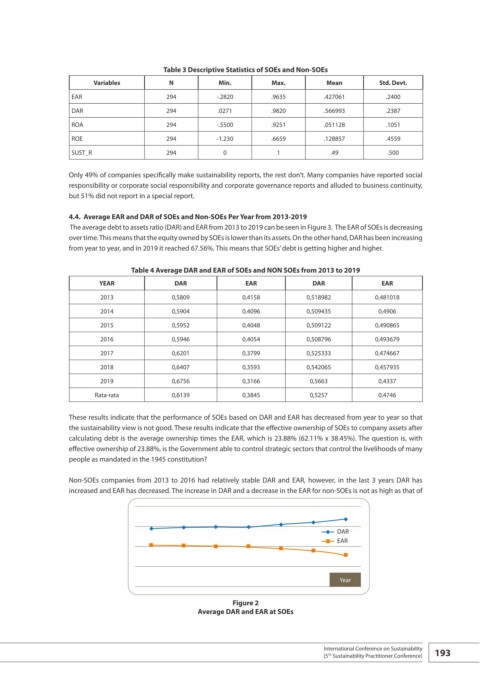
Table 3 Descriptive Statistics of SOEs and Non-SOEs
                        Variables          N           Min.         Max.          Mean         Std. Devt.
                   EAR                    294          -.2820       .9635        .427061         .2400
                   DAR                    294          .0271        .9820        .566993         .2387

                   ROA                    294          -.5500       .9251        .051128         .1051
                   ROE                    294          -1.230       .6659        .128857         .4559
                   SUST_R                 294           0             1            .49           .500

                  Only 49% of companies specifically make sustainability reports, the rest don’t. Many companies have reported social
                  responsibility or corporate social responsibility and corporate governance reports and alluded to business continuity,
                  but 51% did not report in a special report.

                  4.4.  Average EAR and DAR of SOEs and Non-SOEs Per Year from 2013-2019
                   The average debt to assets ratio (DAR) and EAR from 2013 to 2019 can be seen in Figure 3.  The EAR of SOEs is decreasing
                  over time. This means that the equity owned by SOEs is lower than its assets. On the other hand, DAR has been increasing
                  from year to year, and in 2019 it reached 67.56%. This means that SOEs’ debt is getting higher and higher.

                                 Table 4 Average DAR and EAR of SOEs and NON SOEs from 2013 to 2019
                          YEAR              DAR               EAR              DAR              EAR

                          2013              0,5809           0,4158          0,518982         0,481018
                          2014              0,5904           0,4096          0,509435          0,4906
                          2015              0,5952           0,4048          0,509122         0,490865
                          2016              0,5946           0,4054          0,508796         0,493679
                          2017              0,6201           0,3799          0,525333         0,474667
                          2018              0,6407           0,3593          0,542065         0,457935
                          2019              0,6756           0,3166           0,5663           0,4337

                        Rata-rata           0,6139           0,3845           0,5257           0,4746

                  These results indicate that the performance of SOEs based on DAR and EAR has decreased from year to year so that
                  the sustainability view is not good. These results indicate that the effective ownership of SOEs to company assets after
                  calculating debt is the average ownership times the EAR, which is 23.88% (62.11% x 38.45%). The question is, with
                  effective ownership of 23.88%, is the Government able to control strategic sectors that control the livelihoods of many
                  people as mandated in the 1945 constitution?


                  Non-SOEs companies from 2013 to 2016 had relatively stable DAR and EAR, however, in the last 3 years DAR has
                  increased and EAR has decreased. The increase in DAR and a decrease in the EAR for non-SOEs is not as high as that of


                                                                                     DAR
                                                                                     EAR


                                                                                     Year


                                                           Figure 2
                                                  Average DAR and EAR at SOEs


                                                                                 International Conference on Sustainability  193
                                                                                 (5  Sustainability Practitioner Conference)
                                                                                  Th