
Page 192 - SUSTAINABILITY ISSUES & COVID-19
P. 192
Financial performance is measured by DAR (debt to assets ratio), EAR (equity to assets ratio), ROA (return on assets), and
ROE (return on equity). This research is complemented by ownership control variables in SOEs. Ownership is measured
by the percentage of ownership, which is divided into government ownership (Gov), ownership of private domestic or
private institutions (PRIV), foreign ownership or foreign (Forg), and ownership by the wider community, usually a small
amount of ownership less than 5% or public (Publ). Sustainability Report is measured using a dummy variable, that is,
if the company discloses a specific sustainability report, it is marked as 1 (one). Conversely, if it does not specifically
present a sustainability report, it will be marked with 0 (null).
4. RESULTS AND DISCUSSION
4.1. Descriptive Statistics
This paper focuses more on the sustainability of SOEs, discussing non-SOEs in the context of being a comparison
with SOEs. The following are descriptive statistics for the variables studied. The average financial performance and
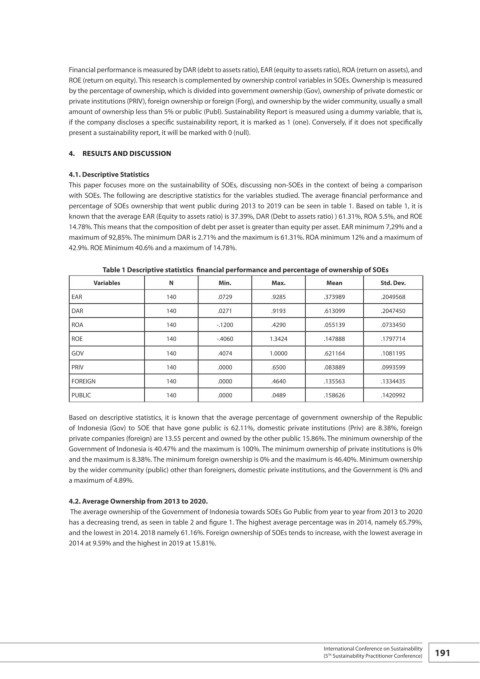
percentage of SOEs ownership that went public during 2013 to 2019 can be seen in table 1. Based on table 1, it is
known that the average EAR (Equity to assets ratio) is 37.39%, DAR (Debt to assets ratio) ) 61.31%, ROA 5.5%, and ROE
14.78%. This means that the composition of debt per asset is greater than equity per asset. EAR minimum 7,29% and a
maximum of 92,85%. The minimum DAR is 2.71% and the maximum is 61.31%. ROA minimum 12% and a maximum of
42.9%. ROE Minimum 40.6% and a maximum of 14.78%.
Table 1 Descriptive statistics financial performance and percentage of ownership of SOEs
Variables N Min. Max. Mean Std. Dev.
EAR 140 .0729 .9285 .373989 .2049568
DAR 140 .0271 .9193 .613099 .2047450
ROA 140 -.1200 .4290 .055139 .0733450
ROE 140 -.4060 1.3424 .147888 .1797714
GOV 140 .4074 1.0000 .621164 .1081195
PRIV 140 .0000 .6500 .083889 .0993599
FOREIGN 140 .0000 .4640 .135563 .1334435
PUBLIC 140 .0000 .0489 .158626 .1420992
Based on descriptive statistics, it is known that the average percentage of government ownership of the Republic
of Indonesia (Gov) to SOE that have gone public is 62.11%, domestic private institutions (Priv) are 8.38%, foreign
private companies (foreign) are 13.55 percent and owned by the other public 15.86%. The minimum ownership of the
Government of Indonesia is 40.47% and the maximum is 100%. The minimum ownership of private institutions is 0%
and the maximum is 8.38%. The minimum foreign ownership is 0% and the maximum is 46.40%. Minimum ownership
by the wider community (public) other than foreigners, domestic private institutions, and the Government is 0% and
a maximum of 4.89%.
4.2. Average Ownership from 2013 to 2020.
The average ownership of the Government of Indonesia towards SOEs Go Public from year to year from 2013 to 2020
has a decreasing trend, as seen in table 2 and figure 1. The highest average percentage was in 2014, namely 65.79%,
and the lowest in 2014. 2018 namely 61.16%. Foreign ownership of SOEs tends to increase, with the lowest average in
2014 at 9.59% and the highest in 2019 at 15.81%.
International Conference on Sustainability 191
(5 Sustainability Practitioner Conference)
Th